Skip to content

Complete reporting for your event activity

Eventdrive reporting is not an analytics layer added afterward. It is the real-time synthesis of all your centralized event data, visualized and exportable without manual handling.

A dashboard that consolidates all your data

Eventdrive gives you a complete and detailed view of your entire event activity : by event, by category, by team, with full transparency on the performance and impact of your actions.

dashboard - Reporting - eventdrive

Two levels of reporting tailored to your needs

Per event:  monitor performance live

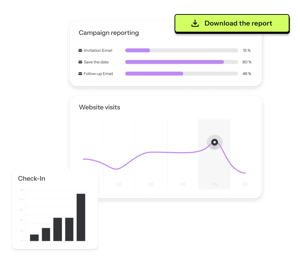
Track your event website traffic, registrations, campaign performance, day-of attendance, and participant engagement in real time. You can adjust actions during the event or generate a complete report as early as the next morning.

Website visits  
Registrations  
Campaign performance  
Day-of attendance  

By organization: manage your strategy

Get a complete view of your event portfolio: activity by team, by category, and by period. This reporting level is useful for communication leaders who need to justify budgets, compare formats, and standardize what works, not just manage one event at a time.

The list of events over a given period  
The list of events organized by team  
Events currently being prepared  
Events scheduled for the month  

Turn numbers into strategic opportunities

Eventdrive reporting automatically consolidates the data generated by all platform features: registration forms, email & SMS campaigns, check-in, satisfaction surveys, and interactive features. No manual handling, no file merging.

  • Real-time data

    Track the performance of your actions as soon as they happen (email campaigns, website visits, most popular interactions on event day, etc.). Quickly adjust what needs to be improved and identify trends throughout the event.

  • A way to refine your ROI

    Evaluate the overall impact of your events. Measure return on investment and identify your most profitable events.

  • Easy-to-share reports

    Easily export your reports, share results with your teams, management, and/or external stakeholders, and move quickly into action.

  • A better participant experience

    Listen to your participants and adapt your events according to their expectations. Their feedback will help you improve their experience.

  • Event website traffic and visitor tracking (UTM)
  • Data visualization through donut charts, curves, and histograms
  • Statistics available for your live streaming events
  • Survey results and exports
  • KPIs for your campaigns, check-in, and interactive features
  • Fast export of event reports

They organize their events with Eventdrive


Fond CTA prallax (3)

Want to know more?

We show you, you decide