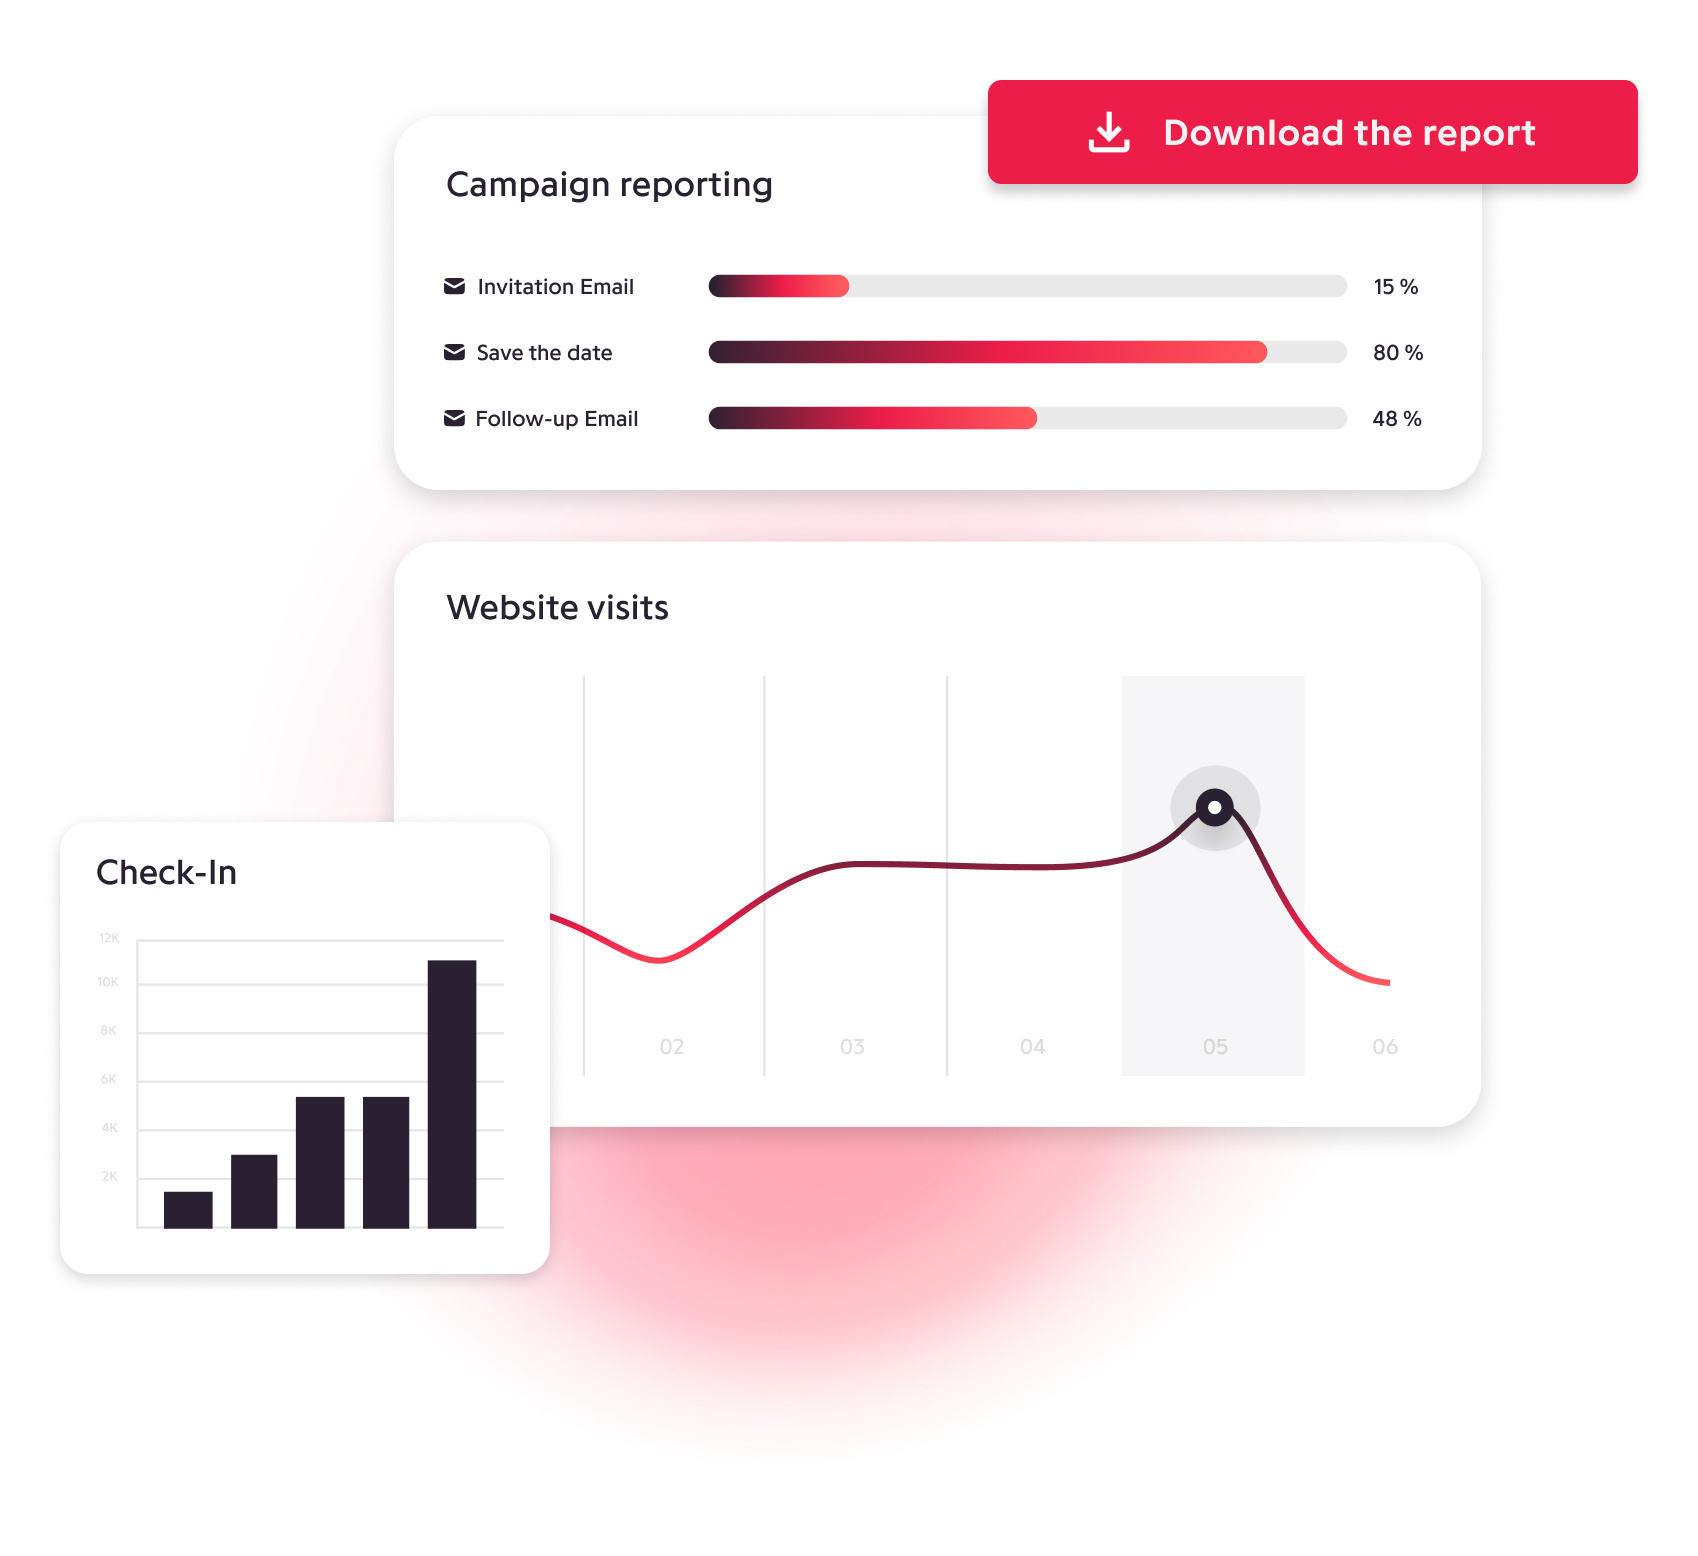
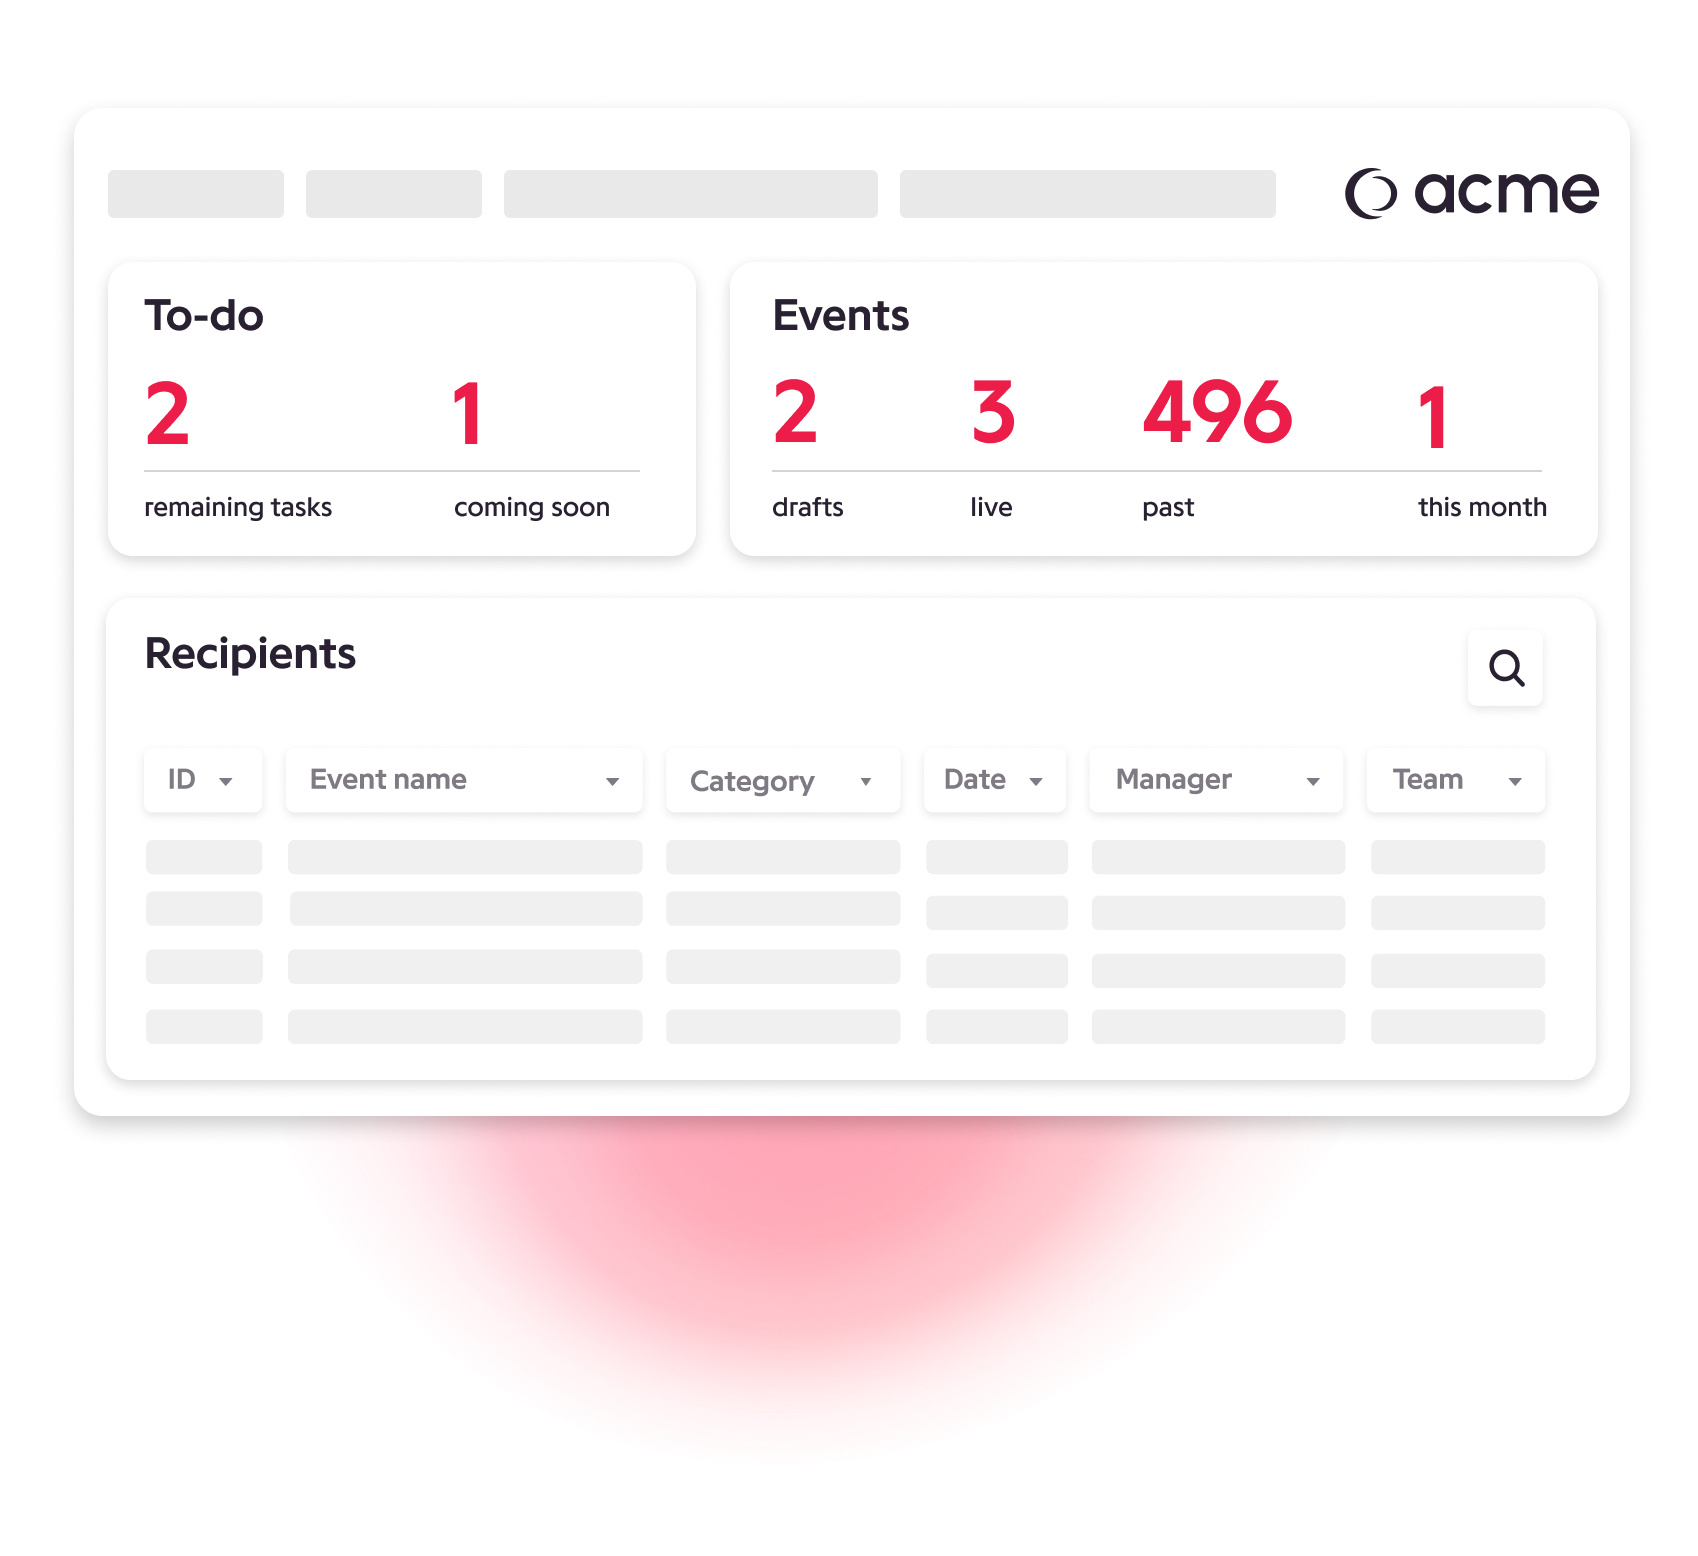
Create the perfect statistical tool for your event
Measure the success of your event
A high engagement rate is often associated with a successful event that has engaged its audience. So access the event data and find out if your event is a success.
Data visualization with charts
With a clean design, effectively visualize your ROI in the form of colorful charts: rings, curves, histograms...
Detailed statistics
Find out how many visitors came to your website, how many participants were signed up, how many people participated in your interactivity and much more!
Improve your next events
Thanks to these quantified feedbacks, optimize your campaigns to continuously improve the engagement of your participants.
Ils créent leurs événements sur Eventdrive
Eventdrive is a communication tool I don't want to do without. It's all ready, coded, easy to communicate with my guests!
Julien Carlier
Project manager in digital strategy and sports events, Sportpack
The best tool to collect the event data
Data visualization
Visualize your data in the form of rings, curves and histograms.
Website statistics
Analyze the number of visitors, the number of page views, the device used, the browser used, the operating system and the type of audience.
Digital registration data
Analyze the number of people attending your event, the absence rate and the average attendance per day.
Statistics of persons connected to the application
Analyze how many people are connected to your application, from which device and which operating system.
View Segmentation
Segment the views by speakers, sponsors, exhibitors.
Interactivity Data
Find out all the information about your word cloud, voting, quizzes, shared messages, shared photos and networking.
Choose Eventdrive to collect your event data
Boost your events by collecting and analyzing data from your previous events!